Subframe Preselection with Siril
Selection Parameters: Background, FWHM, and Quality
This tutorial demonstrates how to filter your subframes to achieve a higher-quality stack. A prerequisite is a registered sequence (e.g., created via the OSC_Preprocessing.ssf script).
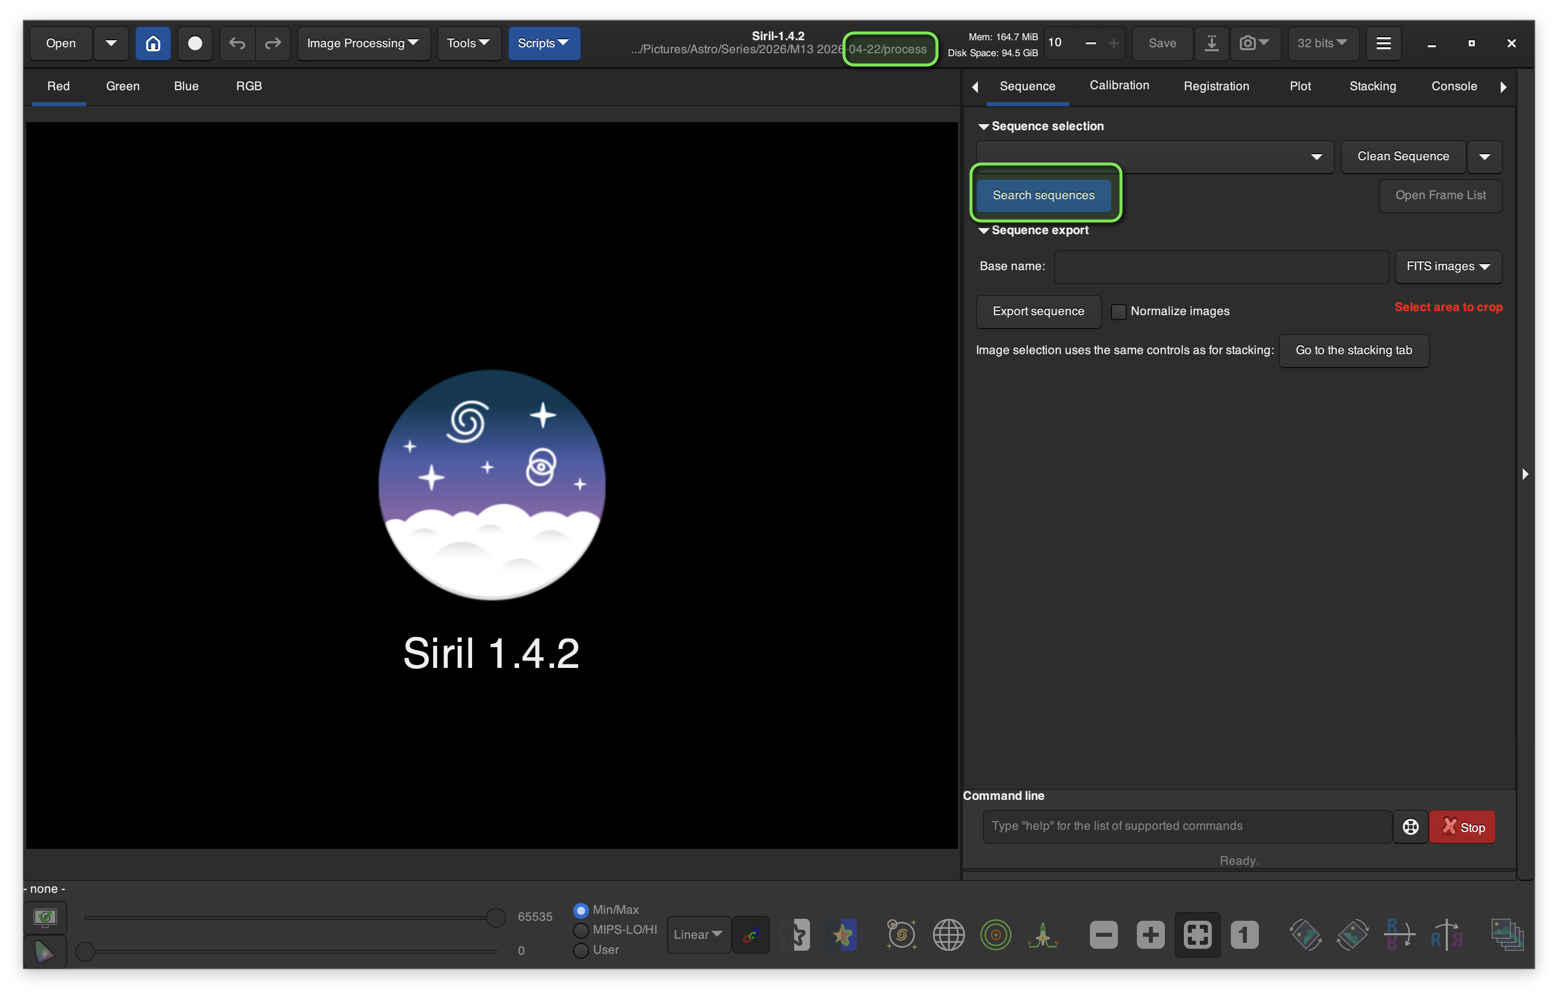
First, set Siril’s working directory to your sequence location (typically the process folder). Navigate to the Sequence tab and click Search Sequences:
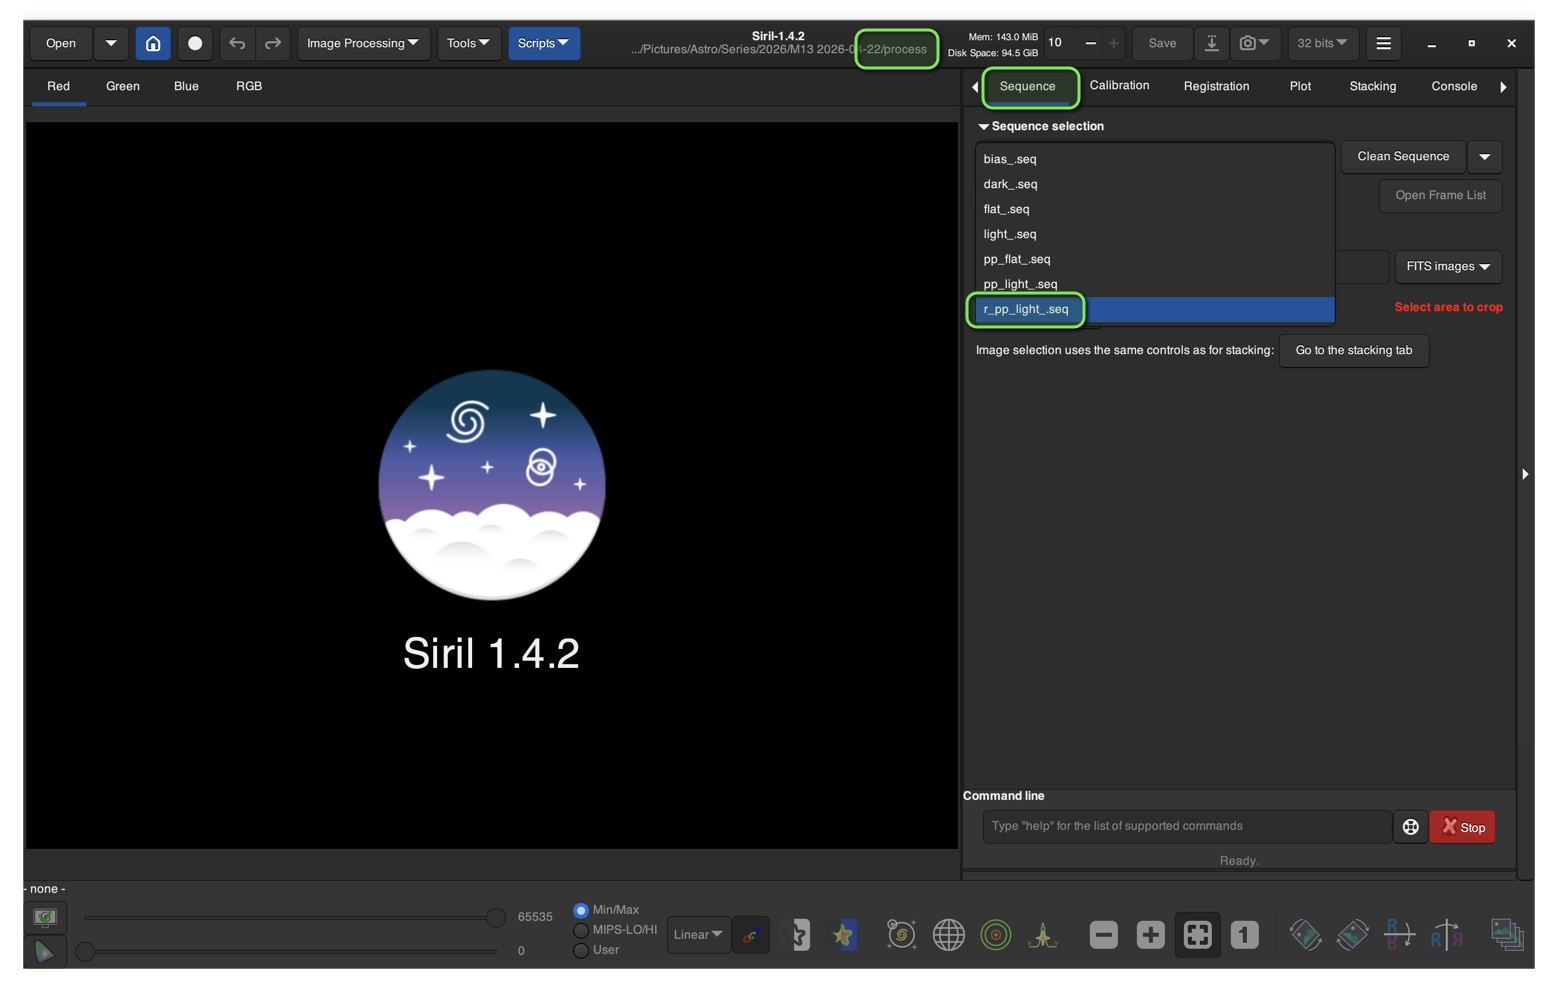
Open your sequence of registered light frames:
Analyzing the Data
Head over to the Plot tab to analyze the quality of your frames. It is recommended to use Autostretch view to visually inspect the frames while browsing the data.
First, let’s examine the FWHM (Full Width at Half Maximum) values per frame. This metric indicates star sharpness:

The animation below illustrates the visual difference between a “bad” frame (bloated stars) and a “good” frame (sharp stars):
Similarly, we can inspect Star Roundness to identify frames with tracking issues or wind shakes:
Finally, the Background level can be used to filter out frames affected by passing clouds, moonlight, or increasing light pollution:
Does Preselection Matter?
To evaluate the impact of filtering, we compare the following metrics:
| Metric | Expectation |
|---|---|
| FWHM | Lower is better (sharper details). |
| Roundness | Closer to 1.0 is better (perfect circles). |
| Background | Lower is better (higher contrast). |
| SNR | Higher is better (less noise). |
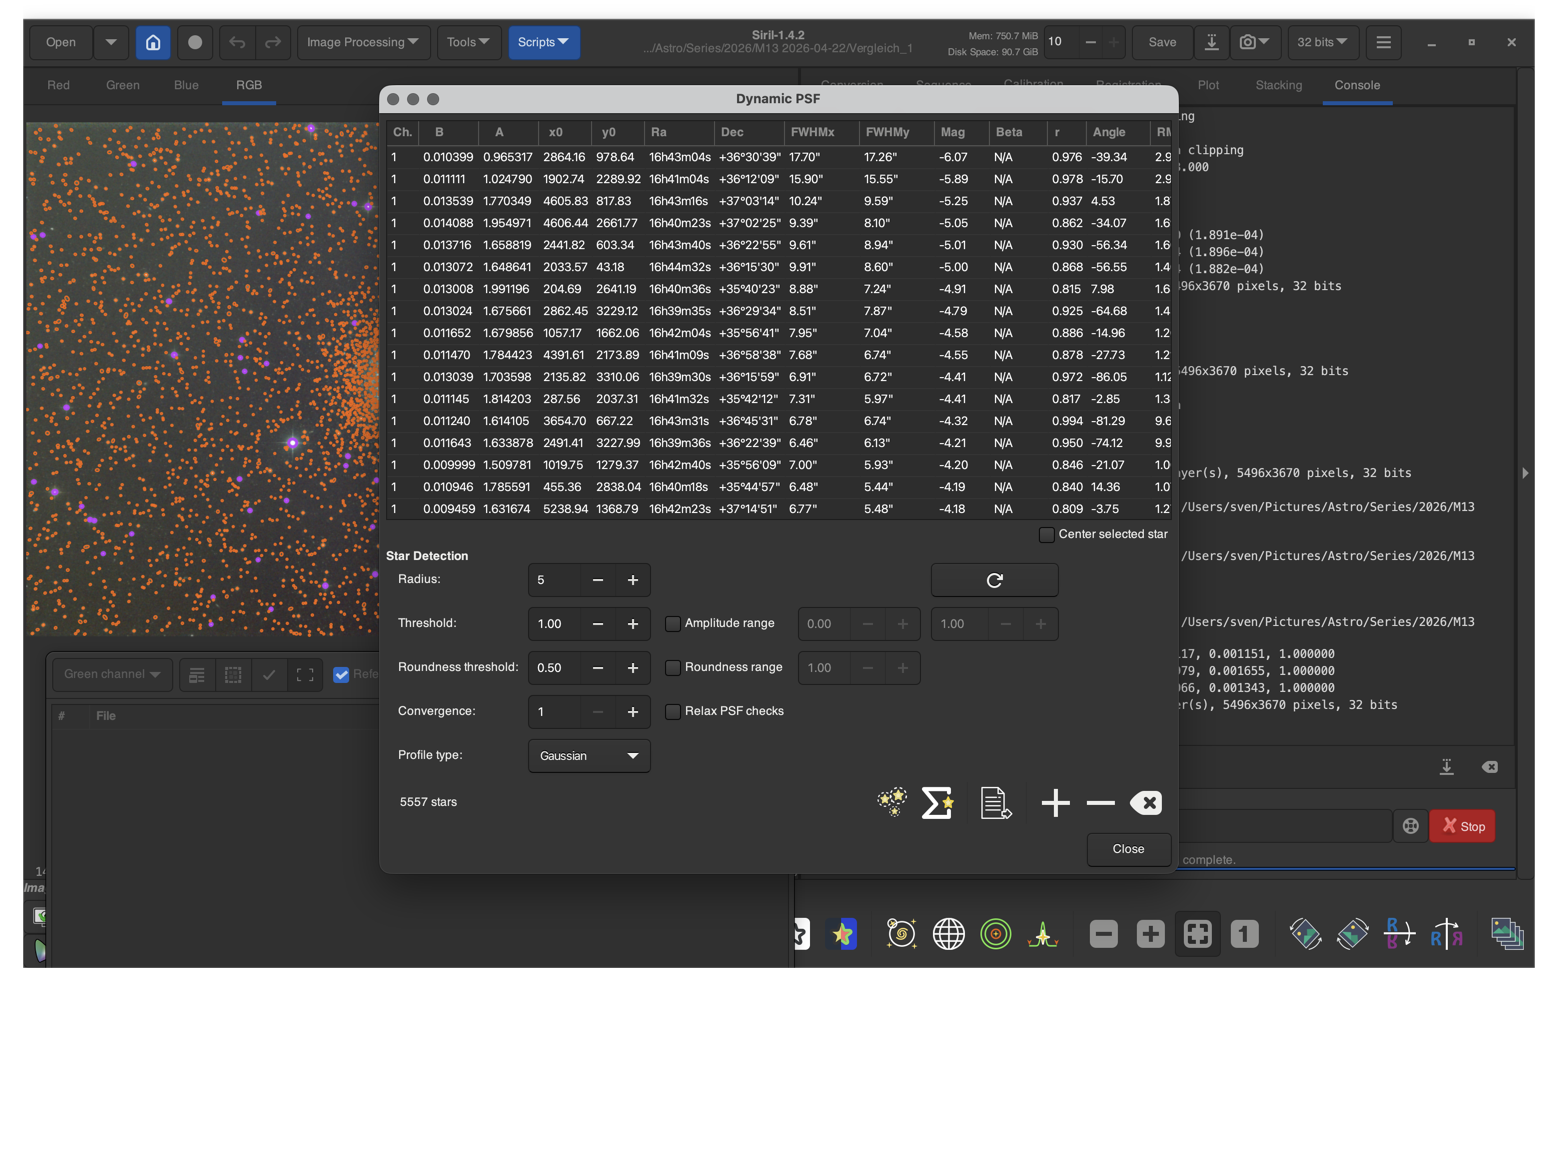
By running a Dynamic PSF analysis on both the full stack and the filtered selection, we can quantify the improvements.
Results & Comparison
| Parameter | Full Stack | Selection | Observation & Impact |
|---|---|---|---|
| L (No. of Frames) | 195 | 133 | Number of integrated light frames. |
| N (No. of Stars) | 5389 | 5557 | Higher count: Better SNR and sharpness allow for detecting fainter stars despite fewer frames. |
| B (Backgr.) | 0.009034 | 0.005775 | Effectively reduced: Lower background leads to significantly better contrast. |
| A (Amplitude) | 0.058814 | 0.066946 | Increased: Stars stand out more clearly against the noise floor. |
| FWHM x/y | 4.35” / 3.88” | 4.24” / 3.80” | Improved: Resulting in a crisper image with finer details. |
| r (Roundness) | 0.891 | 0.895 | Improved: Stars are closer to being perfect circles. |
Conclusion on SNR: Since the Amplitude (Signal) increased while the Background (Noise floor) decreased, the overall Signal-to-Noise Ratio (SNR) has significantly improved in the filtered stack, even with 30% fewer frames.
Since it’s always wise to fetch a 2nd opinion, both stacked images were also analysed by PixInsight:
| Parameter | Full Stack | Selection | Observation & Impact |
|---|---|---|---|
| PSF Signal Weight | 3,26E+06 | 3,50E+06 | ↑ Improved: Selection increases overall signal contribution. |
| PSF SNR | 3,79E+07 | 3,68E+07 | ↓ Slight decrease compared to Full stack. |
| PSF Count | 6607 | 6875 | ↑ Improved: More stars detected in Selection. |
| M* | 1,27E+00 | 1,44E+00 | ↑ Increased (no clear practical impact). |
| N* | 1,86E+00 | 2,11E+00 | ↑ Increased (minor relevance). |
| SNR | 4,71E+05 | 4,22E+05 | ↓ Decreased (lower overall SNR). |
| FWHM | 3,14E+04 | 3,06E+04 | ↓ Improved: Smaller FWHM → sharper stars. |
| Eccentricity | 4,50E+03 | 4,41E+03 | ↓ Improved: More circular stars. |
| Median | 6,94E+03 | 3,50E+03 | ↓ Changed background level (normalization/exposure difference). |
| Noise | 1,62E+00 | 1,83E+00 | ↑ Increased noise. |
| Noise Ratio | 4,36E+03 | 4,28E+03 | ↓ Slight decrease |
| Stars | 6201 | 6458 | ↑ Improved: More stars detected. |
| Star Residual | 1,46E+00 | 1,66E+00 | ↑ Increased residuals (worse fit quality). |
| PSF Total Flux | 6,15E+09 | 6,83E+09 | ↑ Improved: Higher total signal. |
| PSF Total Power Flux | 1,32E+11 | 1,45E+11 | ↑ Improved: Higher overall intensity. |
| PSF Total Mean Flux | 1,85E+07 | 2,28E+07 | ↑ Improved: Brighter average stars. |
| PSF Total Mean Power Flux | 6,45E+04 | 9,57E+04 | ↑ Improved: Higher per-star intensity. |
| FWHM Mean Deviation | 2,59E+03 | 2,55E+03 | ↓ Improved: Slightly more consistent star sizes. |
| Eccentricity Mean Deviation | 1,23E+03 | 1,26E+03 | ↑ Increased variation (less consistent shapes). |
| Star Residual Mean Deviation | 1,45E-01 | 1,71E-01 | ↑ Increased variation (less stable fits). |
Ok, these are just numbers. But is it visible?
The following screenshots where taken after Spectrophotometric Color Calibration, Auto Background Extraction and Stretching with Veralux Hypermetric Strectch.
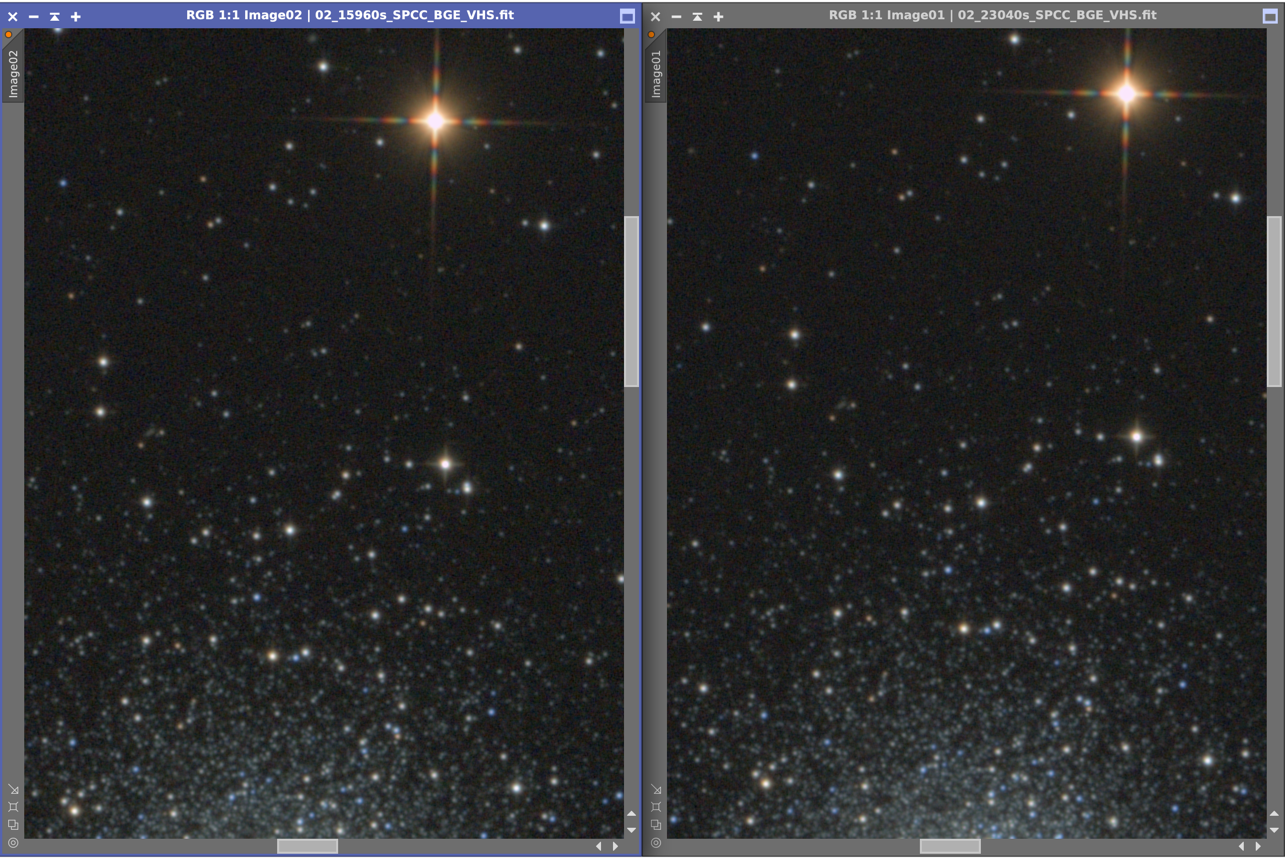
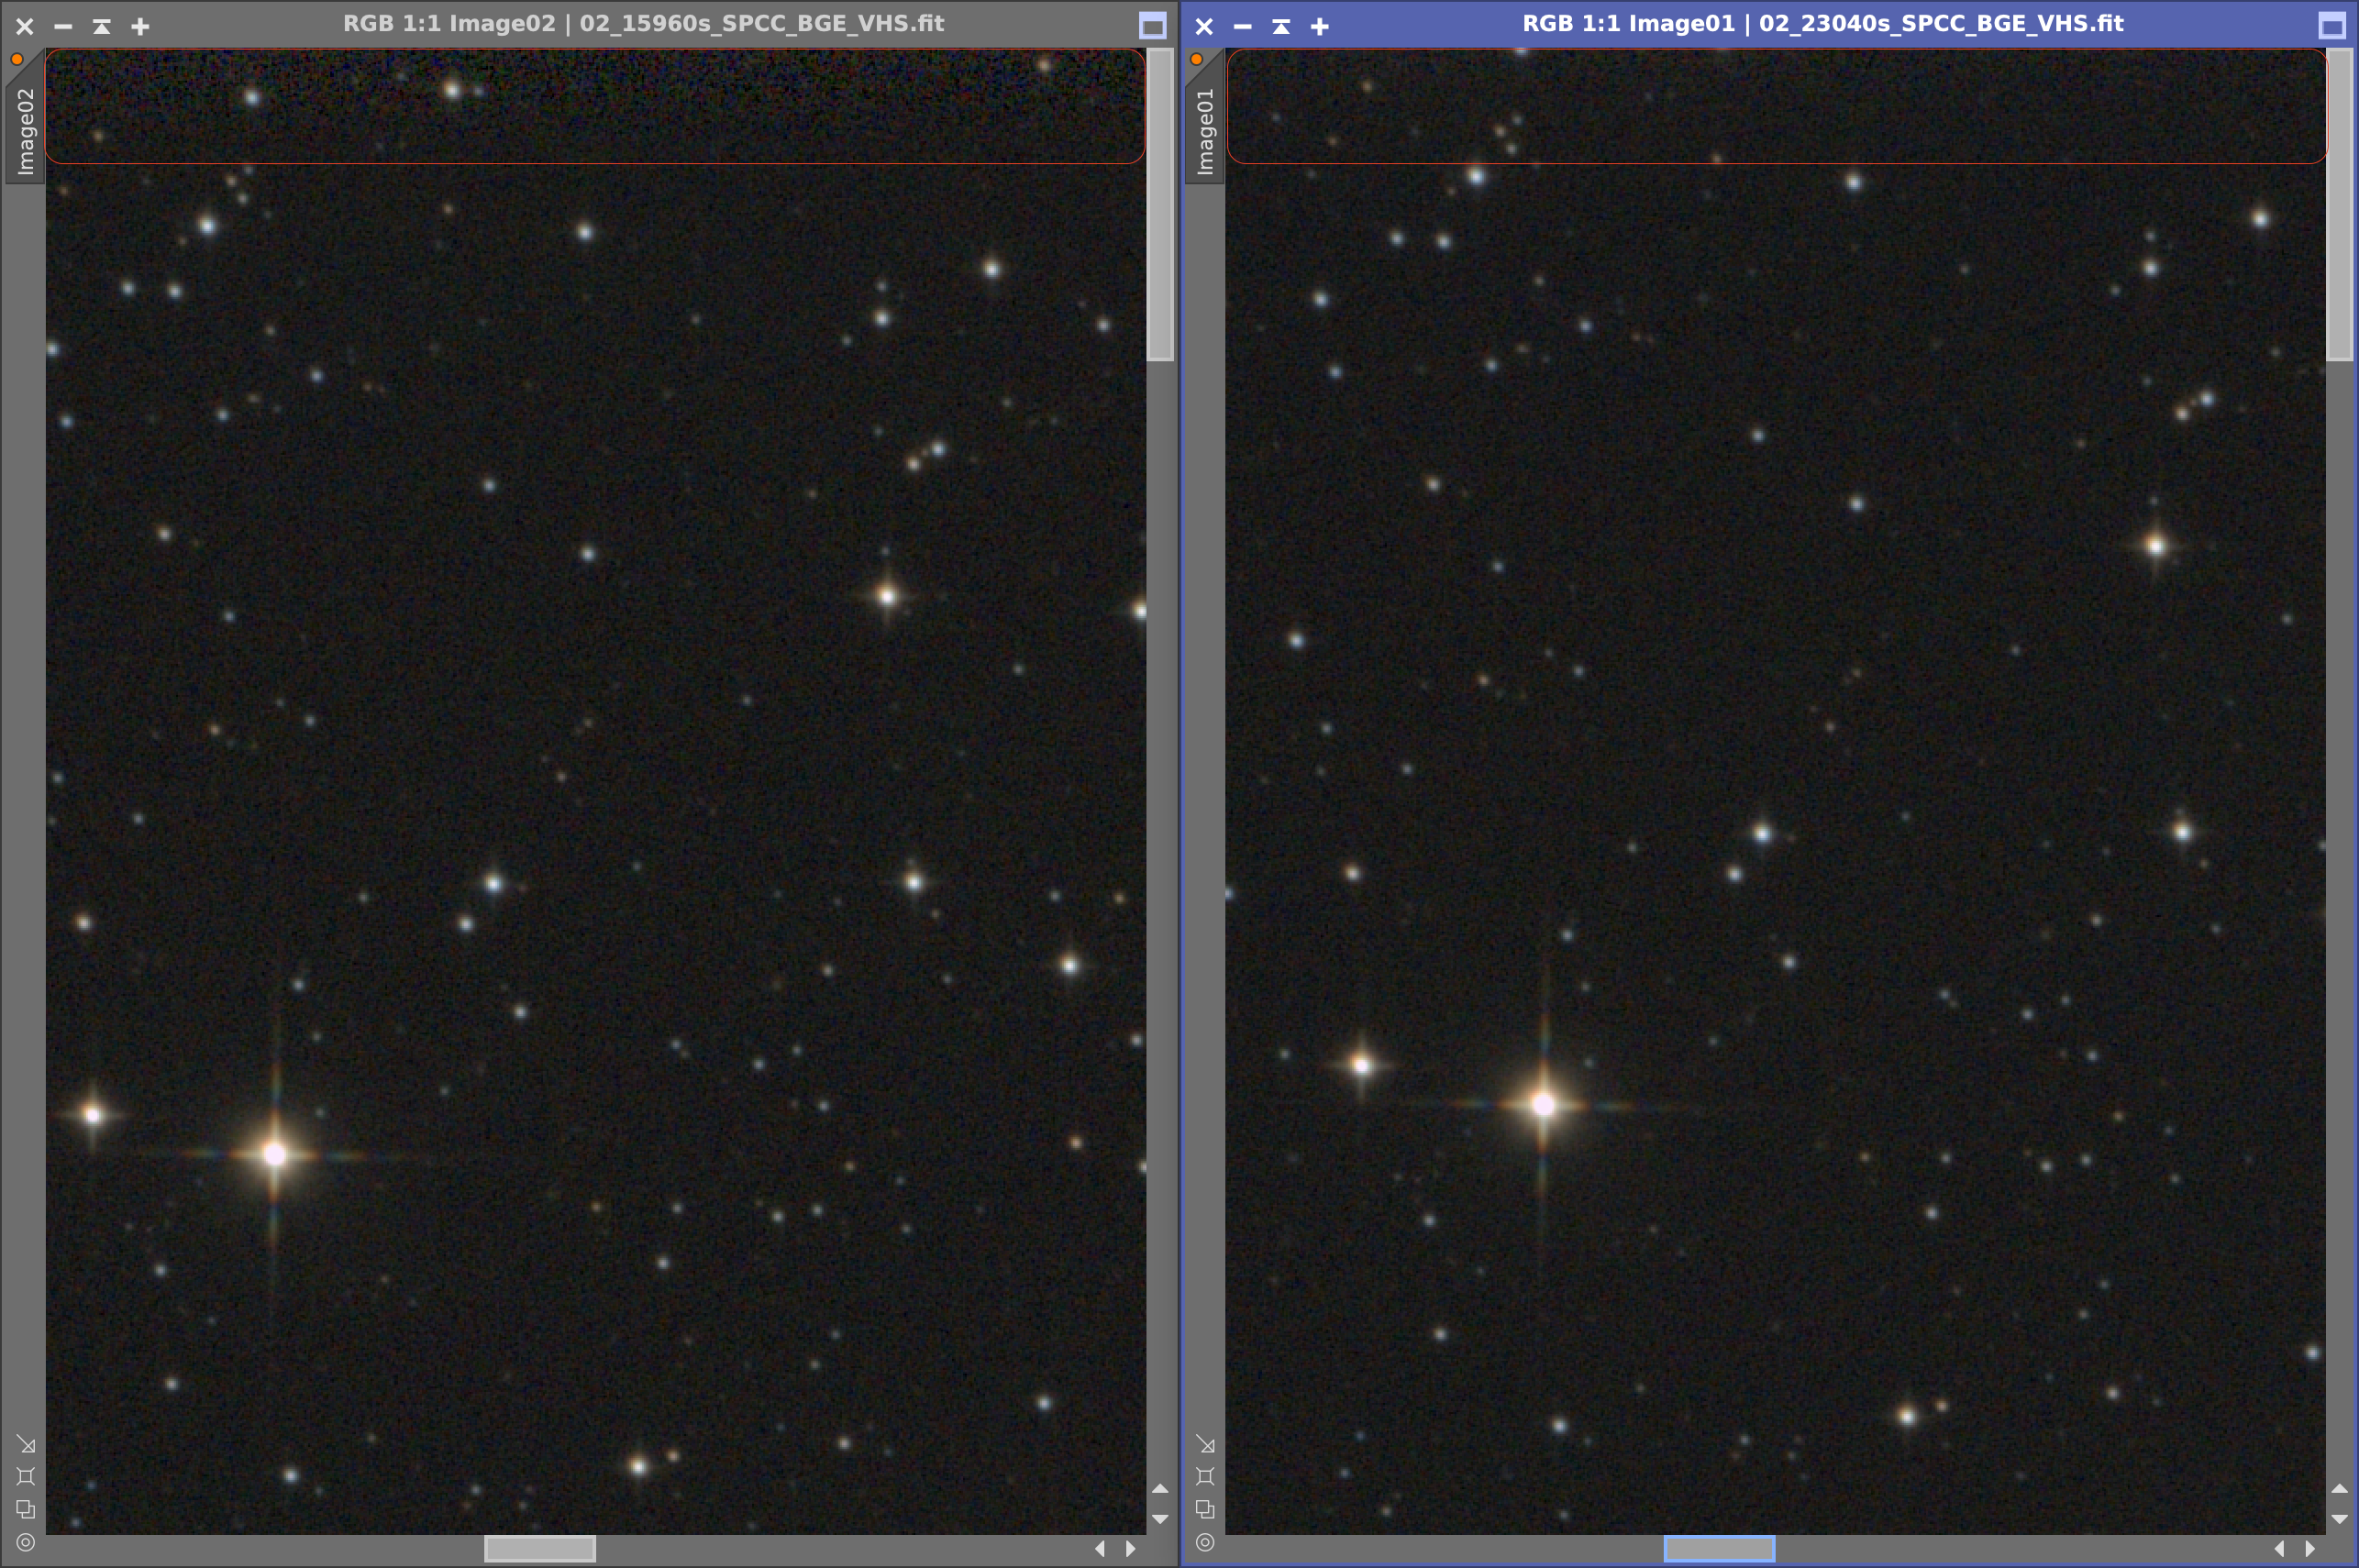
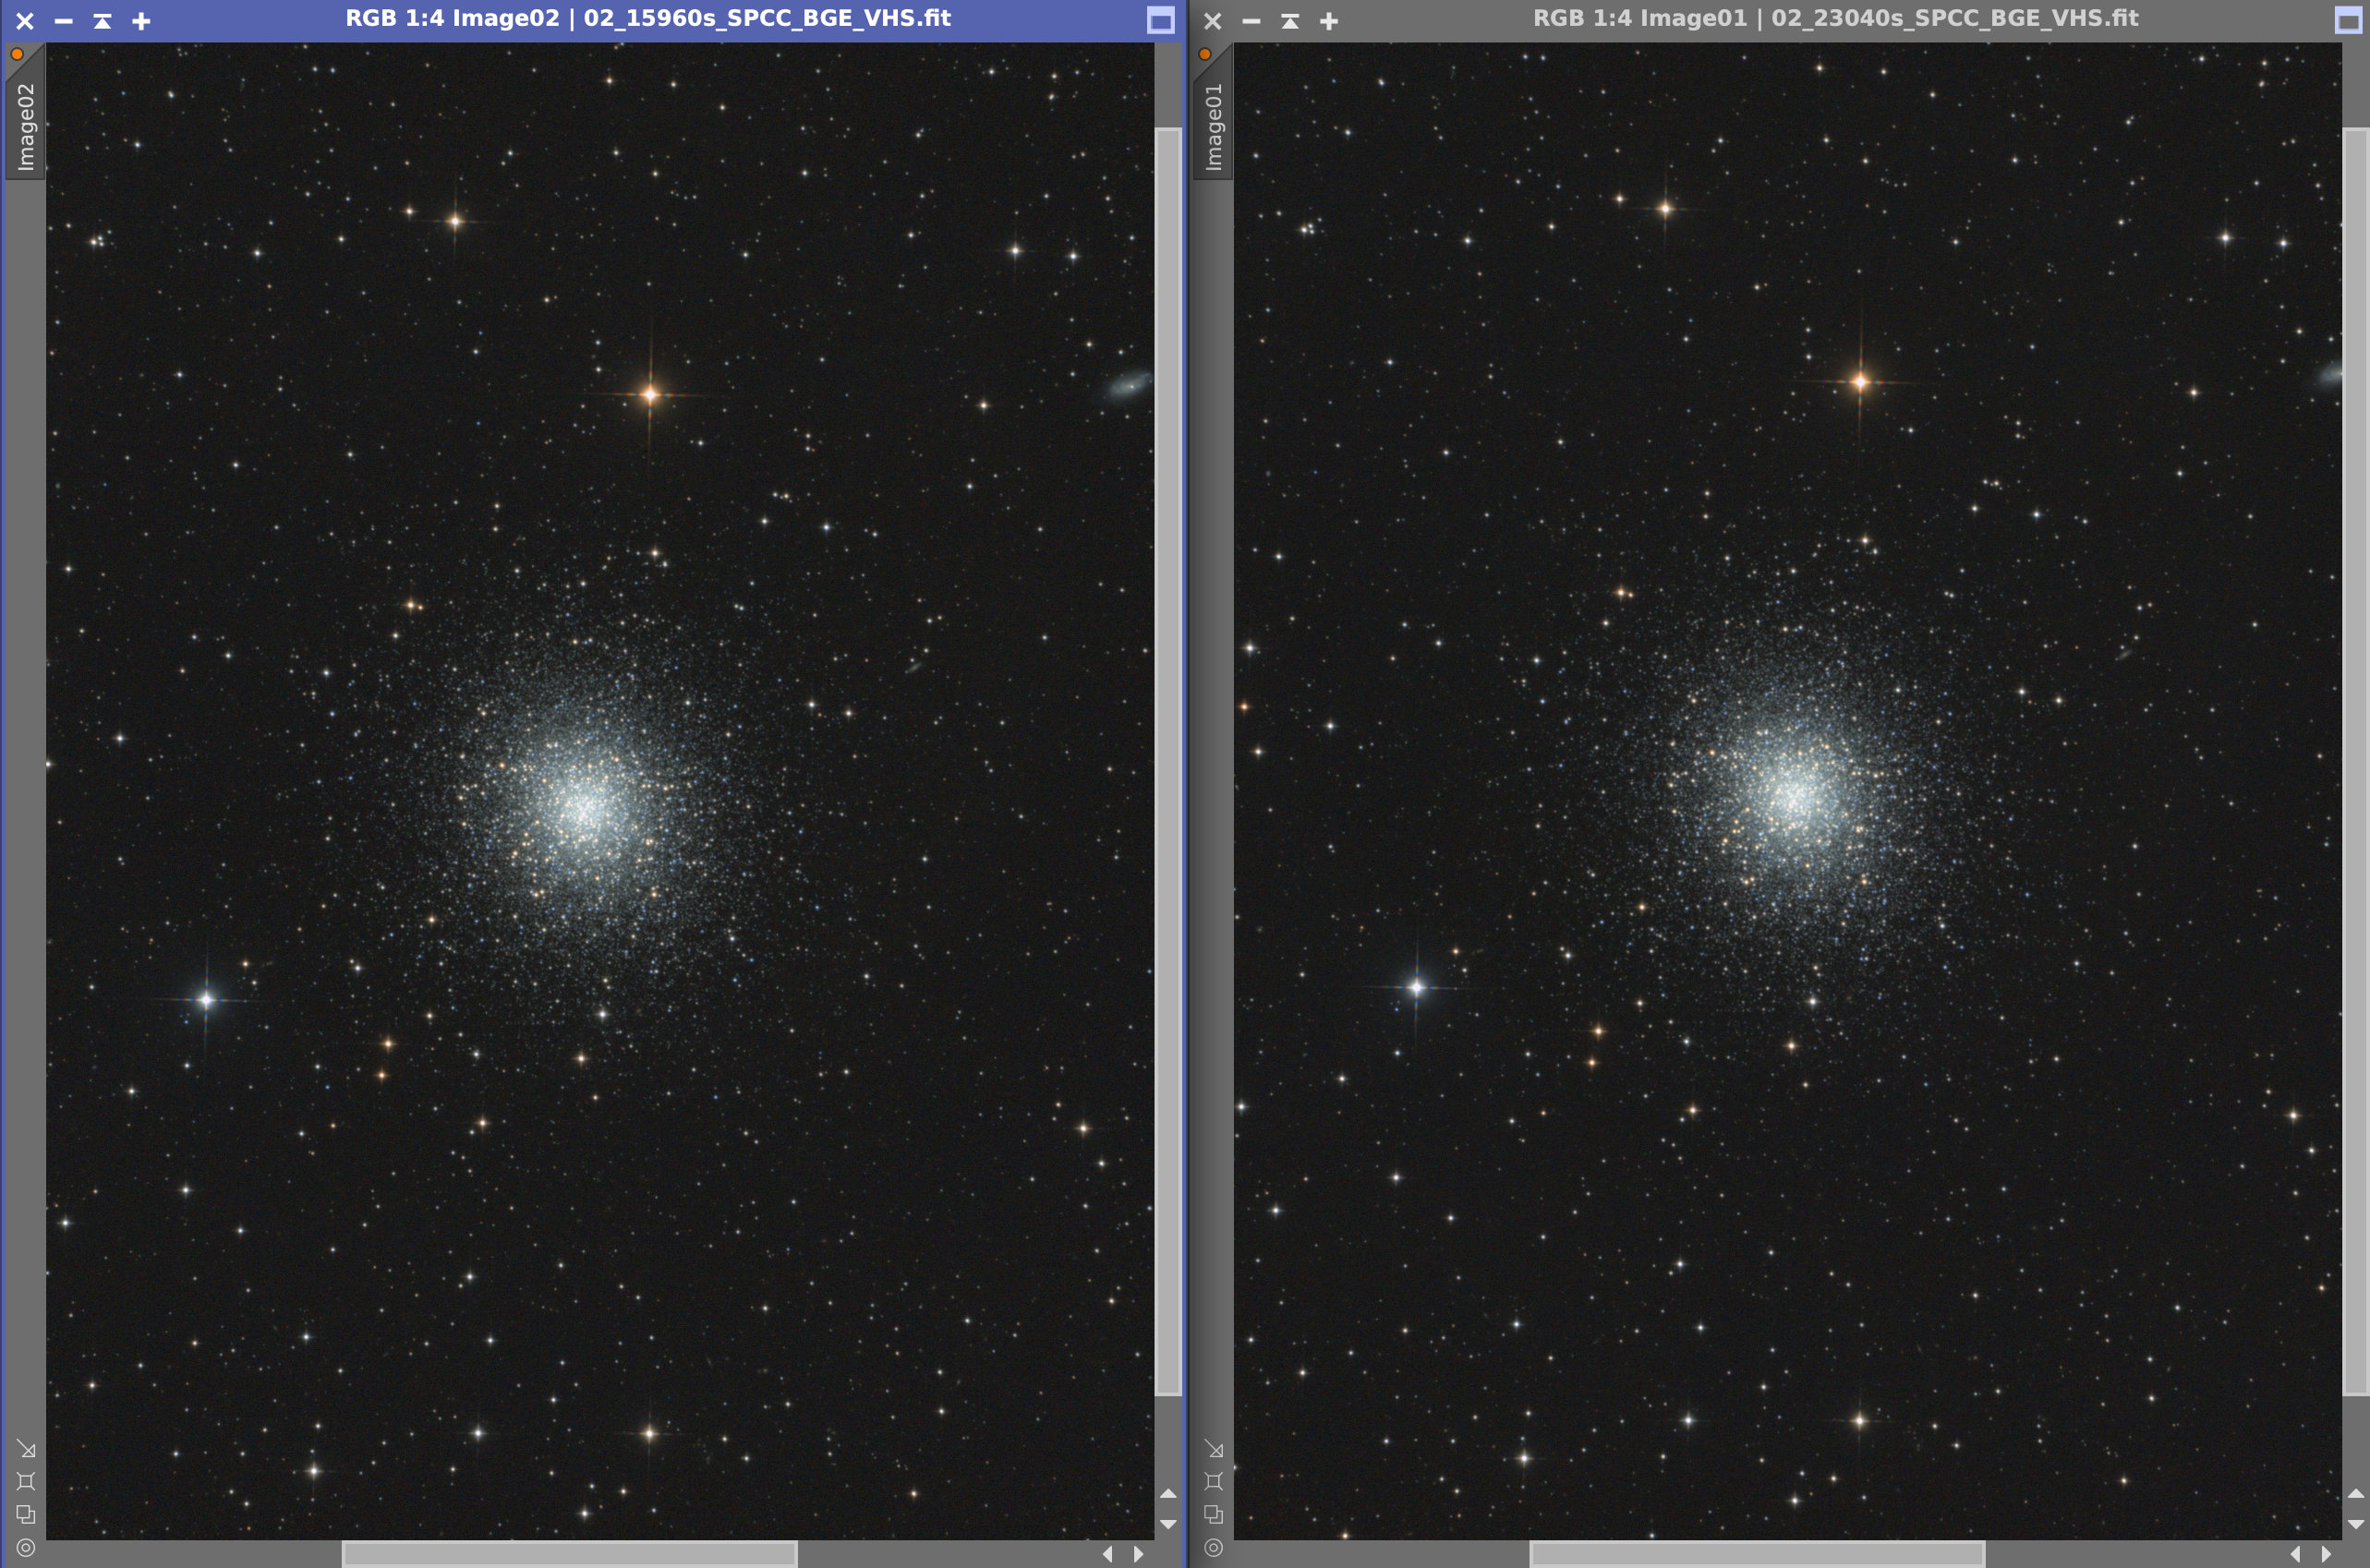
The image based on the selection shows in some areas more noise, nothing what NXT or other tools can’t handle. That’s all I was able to see. Conclusion? Hm, build your own opinion…